Hygiene Index (HI) app is an evidence-based policy tool that enables decision-makers in Indian cities to better understand the challenges of Hygiene and Sanitation conditions. HI app is the part of RB’s Dettol Banega Swachh India (DBSI) campaign.
| Project | Client | Domain | Platform |
| Hygiene Index (HI) | Reckitt Benckiser | Data Analysis | Mobile |
Overview
- People involved: For this product, I got the opportunity to work with multiple teams- RB and DBSI. DBSI Team monitored the overall progress and development from time to time. RB Team acted as stakeholders for the app. The volunteer teams were the users of the application.
- Media: The program was forecasted primarily on NDTV and Mr. Amitabh Bachchan was appointed as campaign ambassador of the program. The app was introduced during the Live streaming of the campaign.
- Duration: The design part was delivered in 6 months.
- Goals and Skills: The app needed to be designed in a way so that it works for both iOS and Android platforms. I picked up on Adobe XD to design the UI mockups of this application.
Introduction
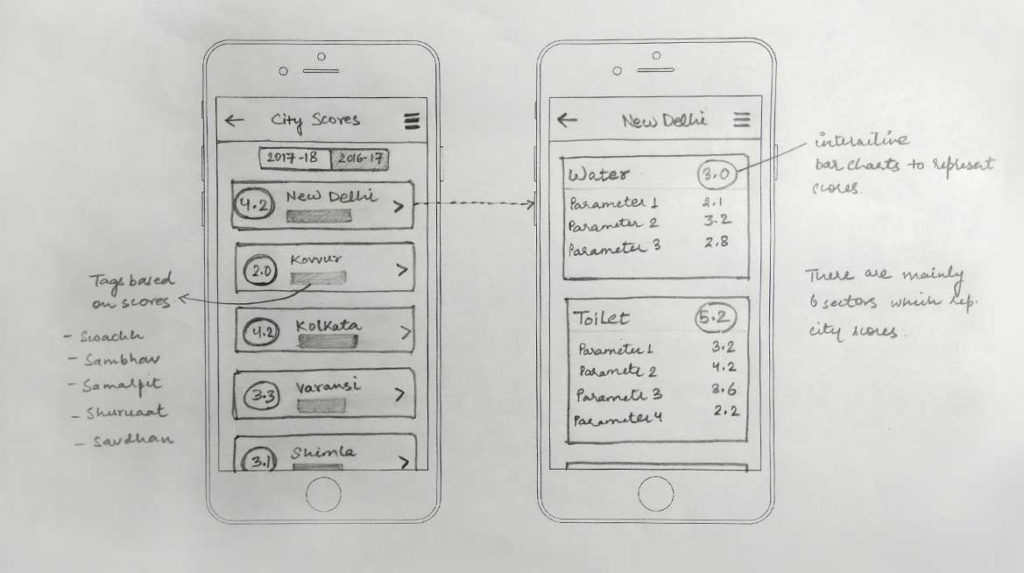
HI app comprehensively evaluates a city’s hygiene & sanitation conditions by focusing on six different sectors that impact hygiene conditions of a city namely- water, sewerage, solid waste management (SWM), toilet, health, and behaviour change communication (BCC).
The team approached us with two clear objectives in mind; first was to have an identity that was synonyms with Swachh Bharat campaign drive, and second to simplify the complexity of the data capturing and representation.
Problem Statement
It was very clear from the beginning that the prime focus of the app had to the data capturing along with the events and updates to keep the users active. Needs were more around the display of content in an appealing format.
User Research
- Requirement Analysis – My journey began with a proper understanding of the field of data analytics; I did meetings with the stakeholders to understand the vision, objective, and business. My focus was directed towards understanding the current landscape to help in crafting the campaign identity. It was very evident that the App must have focused attention on City wise Scores and Rankings.
- Interviews – Several interviews session were conducted in order to understand the data collection fields and their parameters and how collected data can be processed to accumulate the city-wise rankings on the basis of scores.
- Questionnaire – I sent several questionnaire forms that covered a definite set of questions specific to data collection, data representation and other details related to the event’s updates, etc. I worked one-by-one on breaking the complexity of data and ensuring that users could be kept engaged from one touchpoint itself.
Research Takeaways
Users: The app had two types of User – Normal and Volunteers.
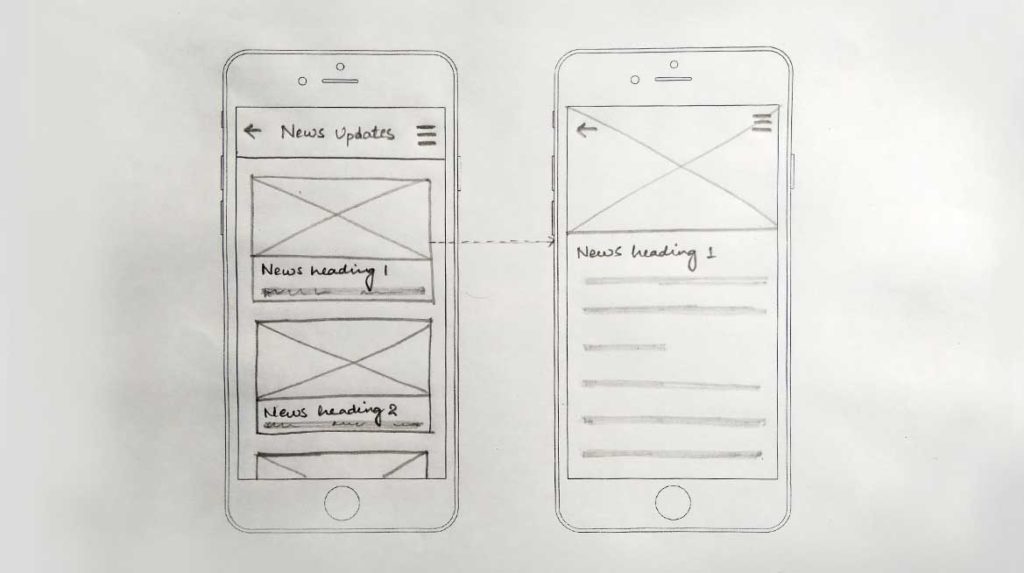
- Normal users: the users who can able to see the city-wise ranking on the basis of compiled scores. These users can view and download the compiled report of the city, check the updates of the nearby events on hygiene and sanitation.
- Volunteer users: the users who would submit data of their city on the pre-defined hygiene parameters of different sectors.
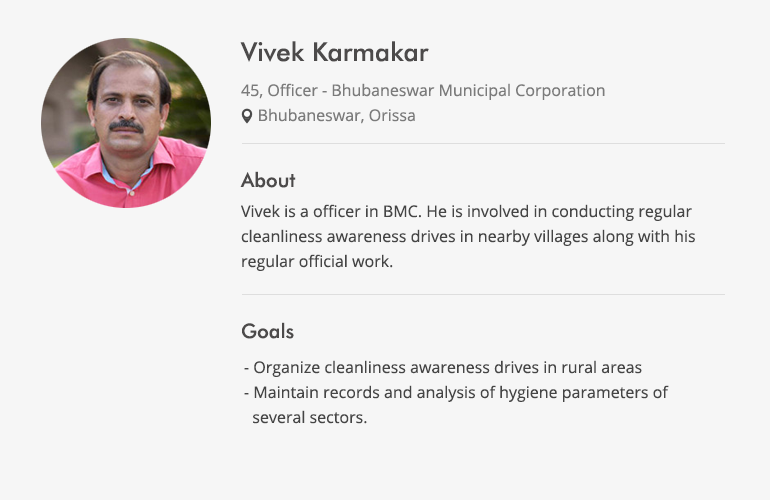
User Personas: Created following user personas for this application. Few were for Normal users and few were for Volunteers.

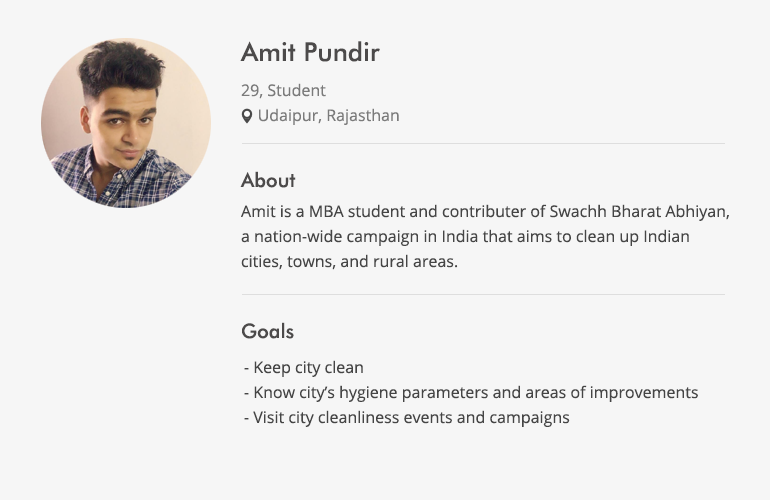

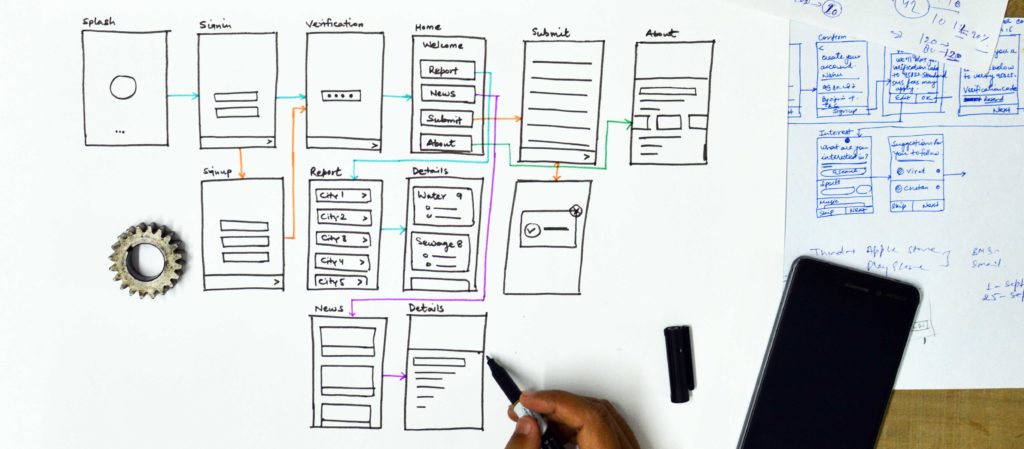
User Flow: Below is the low fidelity user flow of HI app –
Design Approach
- Make a simple and intuitive layout where volunteers can submit the data for their city in presented forms.
- Data submission access to be given to users from the web based CMS.
- Normal users can view the city rankings on the basis of earned scores. They can view the details of a city with all the sector based scores by selecting from listed cities. A normal user did not have access to submit the data.
Design Principles
To integrate seamlessly with the Apple platform, I followed iOS design guidelines to develop HI app. Simple and minimalistic design approach was focused so that the app can be used by a variety of users.
- It was fascinating to ideate and personify the brand. Our inspiration stemmed from the principles of RB and helped us in shaping the identity and logo; our efforts were to ensure that logo communicated how they are instrumental in the Swachh Bharat campaign.
- The base color was used as Pink to draw attention to the details and pump in the enthusiasm and intelligence associated with it. In line with its vision of adding warmth and vibrancy to city scores, five secondary colors were introduced with tags.
- Ample white space has been used with proper line spacing to increase the readability of text.
- Visual elements like animated bar charts, screen transactions, gradients were used to make the app more interactive.
- Focused on easy navigation by empowering users to visualize tons of related data on a single page.
- General behaviors, native components were used to work more efficiently and quickly even if the device is to be in a low network zone.
- For Data capturing, had to ensure that question statements are simple, clear and easily understandable to diverse users.
Sketches
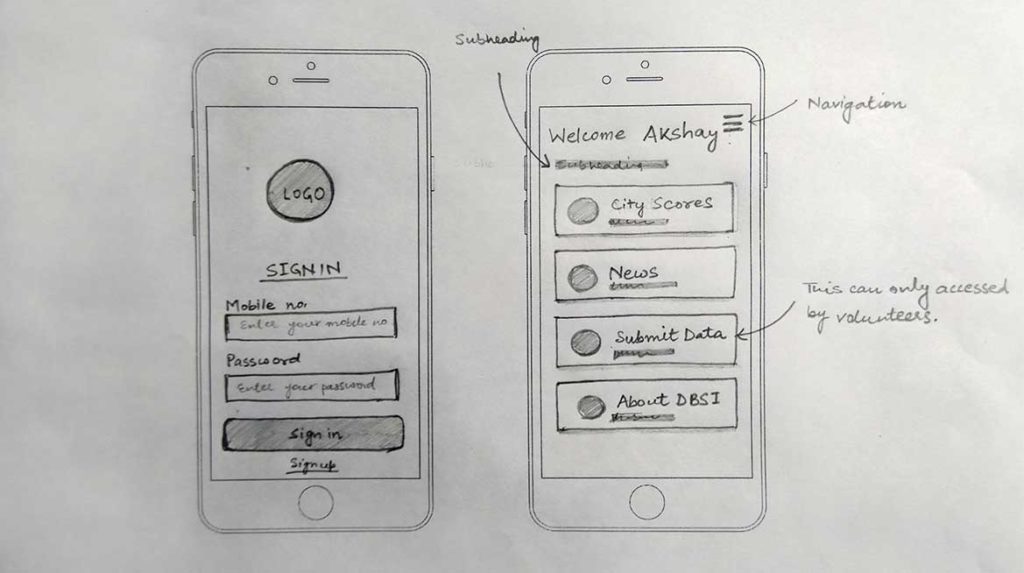
Below are the sketches of the HI app –

Prototype
A prototype was created which covered major flows of the application to view the statistics and data submission.
Usability Tests
HI app has two major modules – data collection and data representation. Both the modules involved different users. I created workflows for both the modules and usability tests were performed with realted users.
UI Screens
The UI Screens of the application can be viewed from here.
UI Dev support and UI Signoff
Collaborated with the app’s development team to provide visual resources like images, icons etc. required for development. Checked entire application in testing environment, shared flaws and bugs with team, got them fixed and finally gave the sign-off on individuals screens.
Application Links
The app is available on both platforms Play Store and App Store.